
Interactive polygon maps and connected IoT sensors modernize daily operations across regional farms
Engineered a centralized web application for an agricultural IoT sensor ecosystem, allowing farming organizations to map fields, track sensor conditions, plan field tasks, and follow crop health through an intuitive multi-farm portal.
PROJECT OVERVIEW
Field | Content |
Client | A long established maker of telecommunications, monitoring, and power equipment, whose range includes IoT sensors for agriculture |
Market | Japan |
Industry | Energy & Environment |
Engagement Model | Design, development, and testing engagement |
Scale and Duration | A complete web app, from basic design and architecture through testing and handover |
Core Technology Stack | Node.js, React, PostgreSQL, AWS, Google Maps, IoT sensors |
ABOUT THE CLIENT
This case study is based on a real VNEXT project. The client's identity and certain project details have been anonymized or generalized for confidentiality purposes.
The customer has spent decades building the equipment and systems that keep essential services running, from telecommunications and monitoring to control and power. One of its newer lines is an IT sensor service for agriculture, and this web app is the software that goes with it. A sensor can describe the conditions in a field, but farmers and the organizations behind them also need a place to plan the work, record what was done, and see how a crop is coming along. The people doing that work are not at desks. They are in paddies and greenhouses, looking after many fields at once, so the software has to fit an outdoor working day and still give management a trustworthy overview.
THE CHALLENGE
A sensor service reaches farmers through its software, so the app had to carry the hardware into the daily routine of a farm. Farm work is tied to place. A task belongs to a particular field, with a particular shape and size, at a particular stage of growth, so the app had to think in terms of land on a map and not rows in a table. Each task also carries detail: who did it, which machinery, which fertilizer, which pesticide, and often a few photographs.
The structure around it mattered just as much. A single deployment would serve many farming groups, each with its own accounts and its own data, and above them sat a central administrator who needed to see across all of them without crossing any lines.
The interface was also still being shaped. In the early weeks the customer refined its screen designs again and again, which is a healthy part of designing something new, and it called for a way of working that did not turn every refinement into rewritten paperwork.
PROJECT OBJECTIVE
The customer wanted a web app for its agricultural IoT sensor service that covers the full loop of farm work: set up the fields, plan the tasks, record what actually happened, and review progress, with administrators at several levels able to manage groups and accounts.
APPROACH AND METHODOLOGY
Letting the design settle before writing it down
While the interface was changing, our team recorded each open point as a QA question and held off on rewriting the design documents until the customer confirmed a final version. It meant a little patience in the early days, and it saved the project from producing and correcting the same documents several times over.
Describing the options and the risks
Whenever the customer proposed a change, our team explained what it would make possible and what risk it might bring, so that decisions were made with both in view and the customer stayed in charge of the direction.
Meeting every day, and again every week
A short daily call and a longer weekly call kept the customer close to progress, while Slack handled quick questions between meetings. Inside our own team, Skype carried the everyday conversation, which kept the customer's channel clear for decisions.
Handing over everything needed to run it
The scope covered requirements review, basic design, development, unit and integration testing, and bug response. At the end, the customer received the basic design documents, an infrastructure construction manual, the complete source code, and the test specifications with their results, so the app could be operated and maintained without depending on us.
TEAM SCALE
Around ten people worked on the project, organized around a project manager who was also the technical lead.
- Project manager and tech lead: set the technical direction, led reviews, and looked after the user experience
- Solution architect: designed the system architecture, the API, and the database
- Business analyst: answered questions about the specification and business logic, and kept the designs up to date
- QC lead: owned the test checklists, tracked quality and deadlines, and proposed process improvements
- Developers and testers: built the app and verified it against the confirmed designs
THE SOLUTION AND TECHNOLOGY STACK
The app follows the order in which farm work actually happens, and each part has its own screen.
What was built
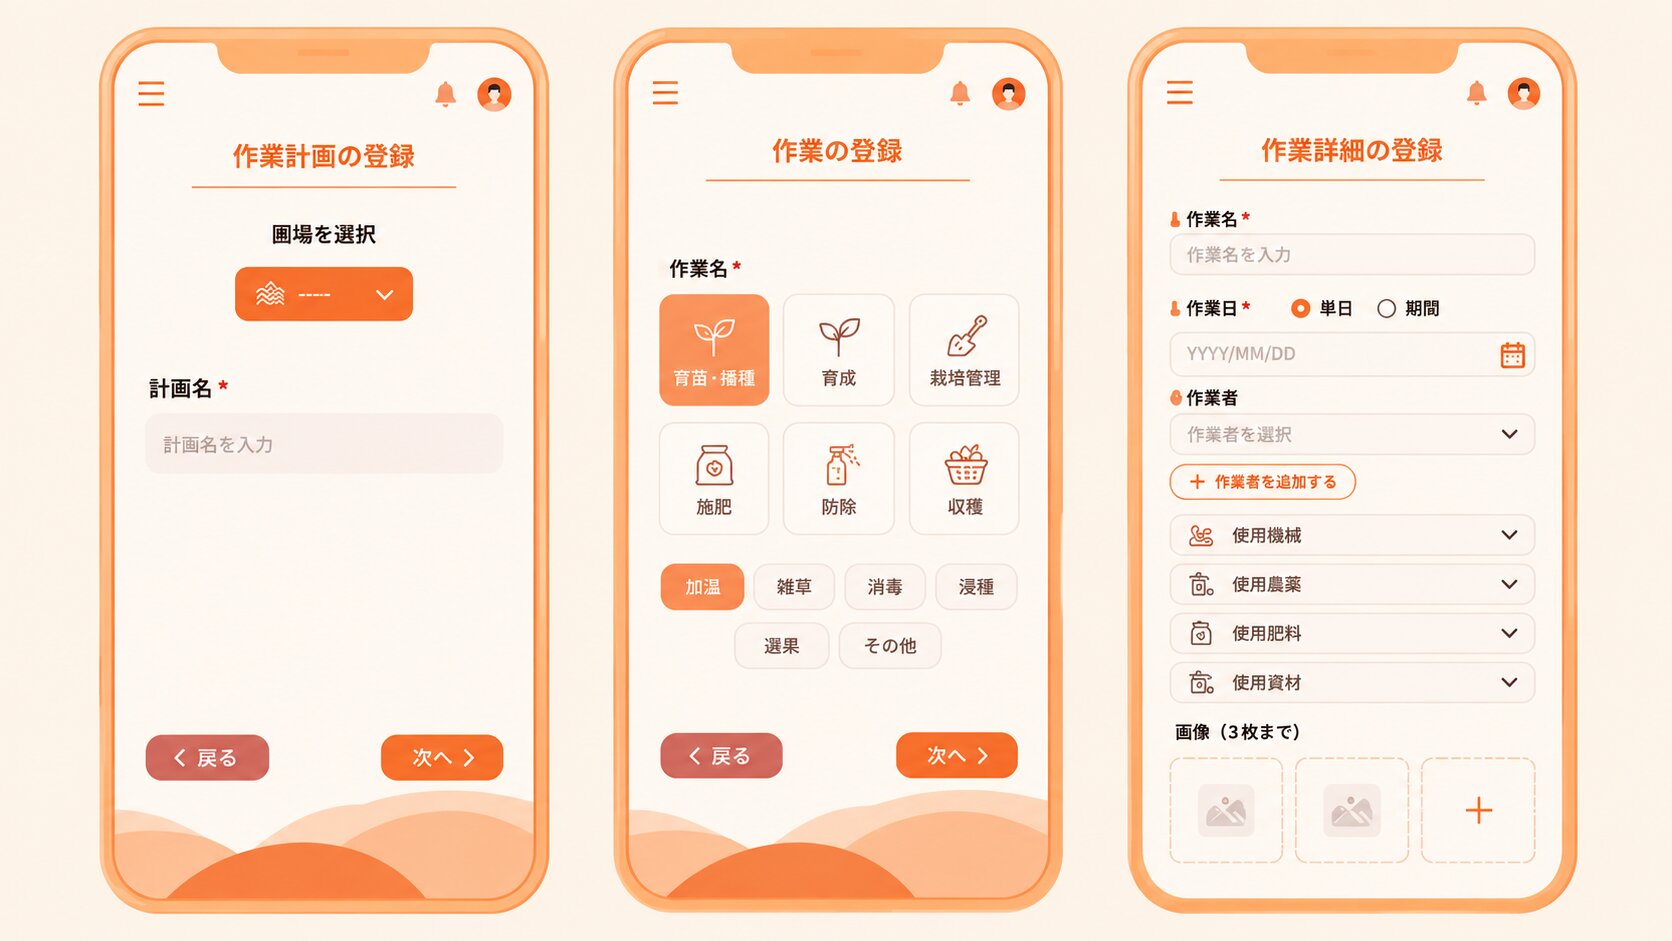
- Fields on a map: each field appears as a shape on a map with a satellite view option, and a current location toggle helps staff find their place in it
- Work plan registration: lets a user choose a field, name a plan, pick the type of task such as seed preparation, seedling care, or tilling, and set a single date or a period
- Work details: records the worker, machinery, fertilizer, pesticide, and materials used, and accepts up to three photographs
- Timeline of plans, records, and notes: lists the planned work for a field, with a button to log the work once it has been done
- Crop progress view: shows the crop, variety, area, planting and harvest schedule, expected yield, and the log of work carried out
- Software for an IoT service: serves as the web application of the customer's agricultural IoT sensor service, so farm records and sensors belong to one connected solution
- Organizations and accounts: lets administrators register farming groups, manage their accounts, and send notifications, with a central administrator above them
Technology Stack
Layer | Technology / Platform Used |
Backend | Node.js |
Frontend | React 18 |
Database | PostgreSQL |
Maps | Google Maps with polygon boundaries |
IoT | The customer's agricultural IoT sensor service |
Hosting and process management | AWS, PM2 |
THE RESULTS
- Farm records that follow the land: fields, plans, and completed work all hang from the same map shape, so the history of a field is in one place.
- Work logged where it happens: a phone sized interface lets a worker record the task, the inputs used, and photographs without waiting until the end of the day.
- One view across many farms: administrators see crop progress and manage groups from a central screen while each group's data stays separate.
- Fewer rewrites during design: waiting for the final screens before updating documents kept the paperwork in step with the product.
- The software side of an IoT service: farm planning, records, and crop progress now live in the same product family as the customer's sensors, which gives that service a practical foundation to build on.
- A complete handover: the design documents, infrastructure manual, source code, and test results were all delivered together.
The customer now has a working base for its farming software, which it can extend with more crops, more task types, and more organizations.
You may also like
-
Measuring project carbon emissions across materials transport and on-site machinery on a unified web platform
-
Automating urban safety with IoT road heating systems
-

A cross service rewards app turns offline kiosk transactions into long term customer loyalty
-

Multi store luxury watch retailers safeguard repair agreements and customer trust through integrated LINE chat
-
A multi portal recruitment platform syncs nationwide job postings across nine external boards
-

A specialized healthcare recruitment portal puts clinics and candidates in direct conversation
-

A custom React frontend brings dense macroeconomic datasets to life alongside the client API team
-
Replacing paper-heavy training records with a unified cloud platform for driving schools
-

Turning a Legacy Showroom into a 24/7 Global Car Marketplace & Auction Engine

Related capabilities
Let's talk
Ready to get results?
Our team is here to help.